11th March Japanese tsunami
From Gerris
A more recent version of these simulations is presented in
S. Popinet - Adaptive modelling of long-distance wave propagation and fine-scale flooding during the Tohoku tsunami
- Natural Hazards and Earth System Sciences 12(4):1213-1227, 2012
- Bibtex
Contents |
Google Earth KML files for the results in the paper above (Figure 15)
Original simulations (March 2011)
- Initial simulation using a crude source model based on CMT solution.
- Refined simulation using a detailed seismic inversion.
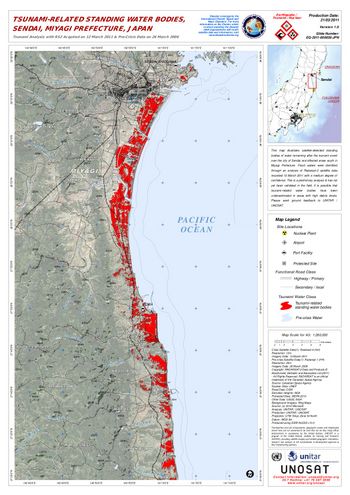
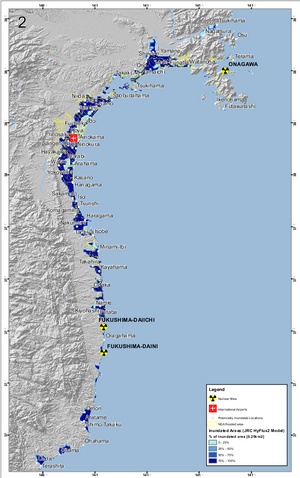
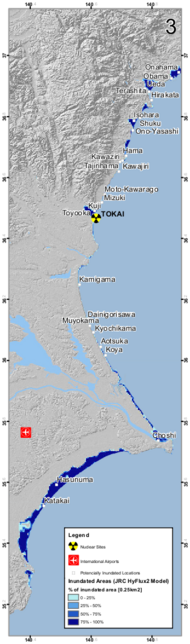
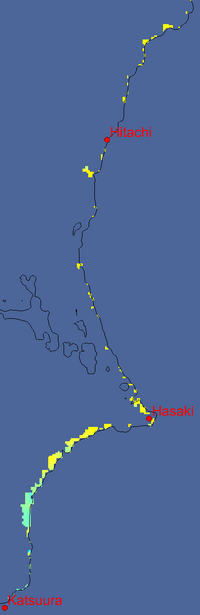
Inundation maps
These maps were generated directly from the results of the refined simulation. The spatial resolution in flooded areas is automatically adapted down to ~500 m. Note that the topography is defined using the ETOPO-1 data (1 arcminute i.e. ~1.8 km). The results below could be improved using higher-resolution topographic data (e.g. STRM).
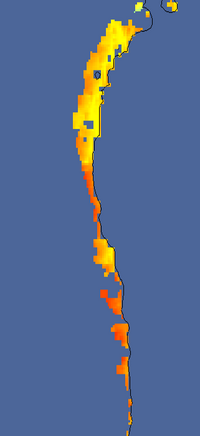
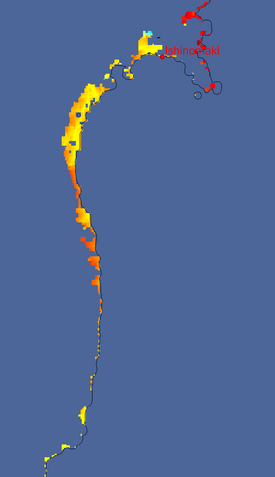
In all Gerris results, the colorscale encodes the log of the maximum wave elevation reached over 5 hours.
 |  |
 |  |
 |  |
