Magnitude 9.0 - NEAR EAST COAST OF HONSHU, JAPAN

Magnitude 9.0 - NEAR EAST COAST OF HONSHU, JAPAN

2011/03/11 05:46:23.82 UTC

About the model

The results presented on this page were generated automatically using the Saint-Venant solver of Gerris. The only parameters used as input were the fault parameters from the USGS CMT solution. This allows for near-realtime forecasting ("nowcasting") of the tsunami event.

Note that the fault model derived only from the initial CMT solution is very crude and will be the main source of errors for the results presented here. Better results can be obtained using finer source estimates, however these improved source models are usually only available hours after the event.

The results presented here must thus be interpreted with the appropriate caution.

The scripts used to generate the results presented on this page are available in the Gerris Automated Tsunami Model (GATM) darcs repository.

Contents

Location, bathymetry and source model

Bathymetry and positions of populated places, DART buoys and GLOSS stations. Bathymetry from ETOPO1.
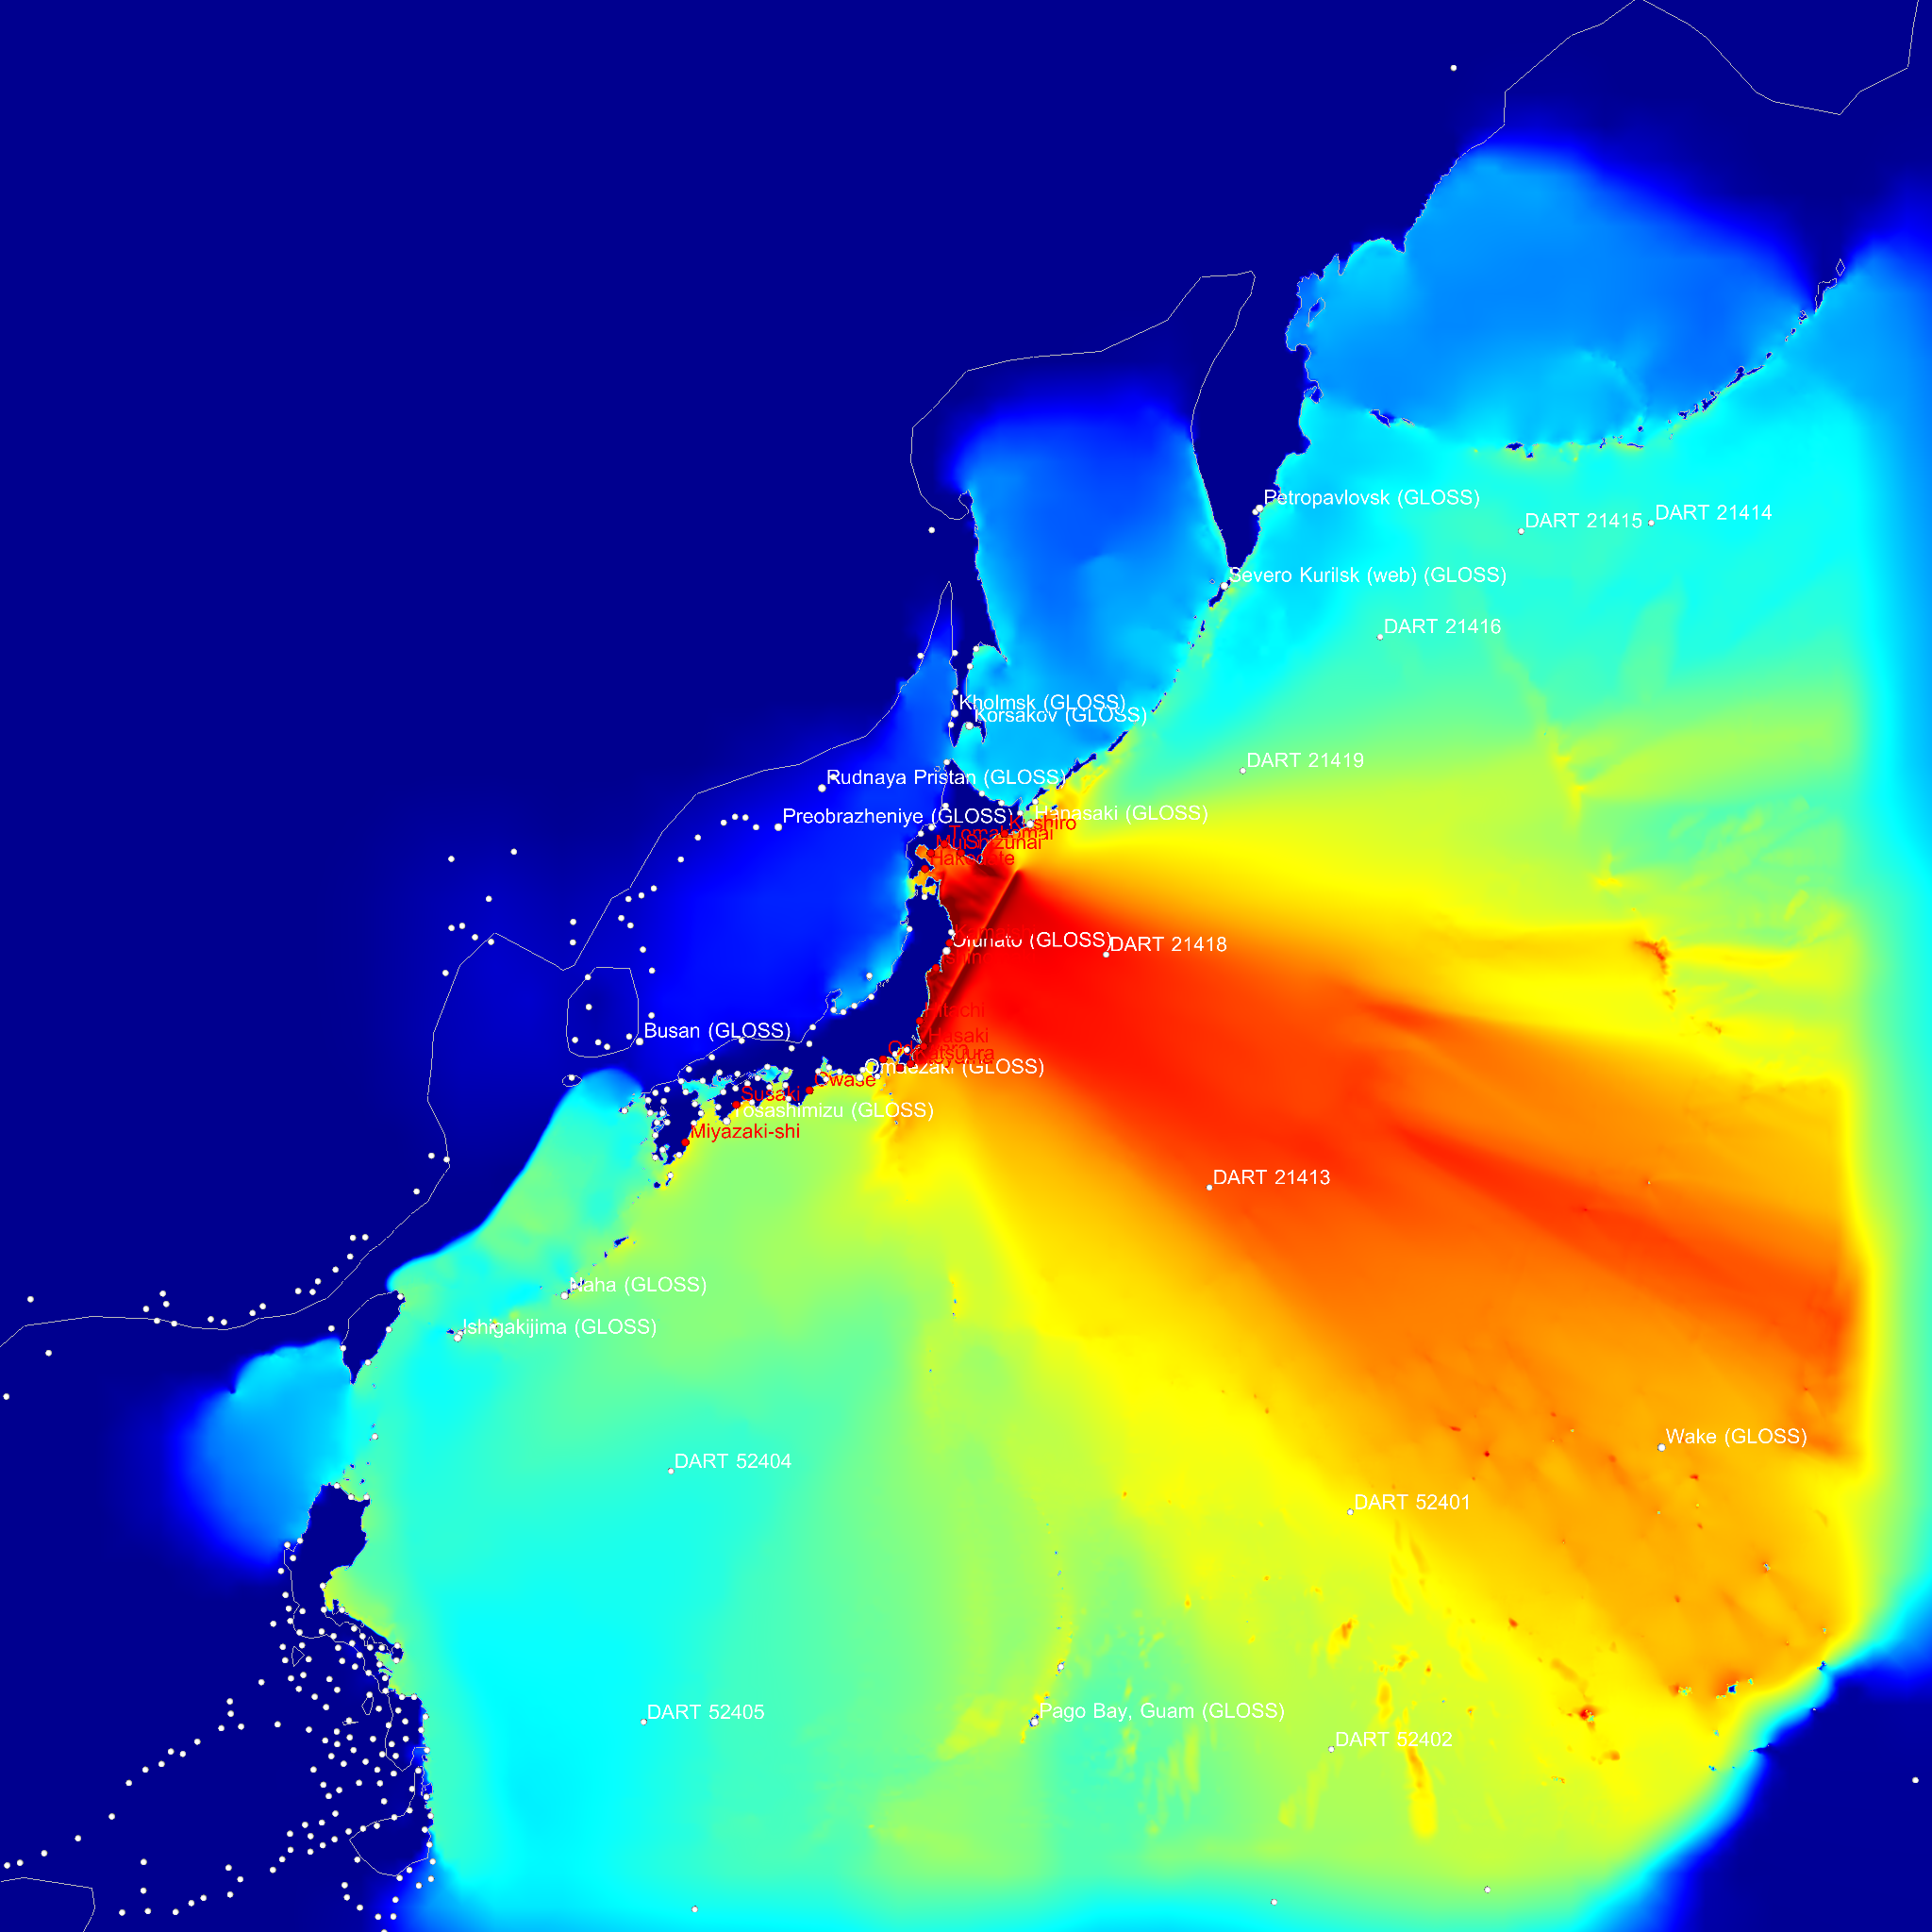
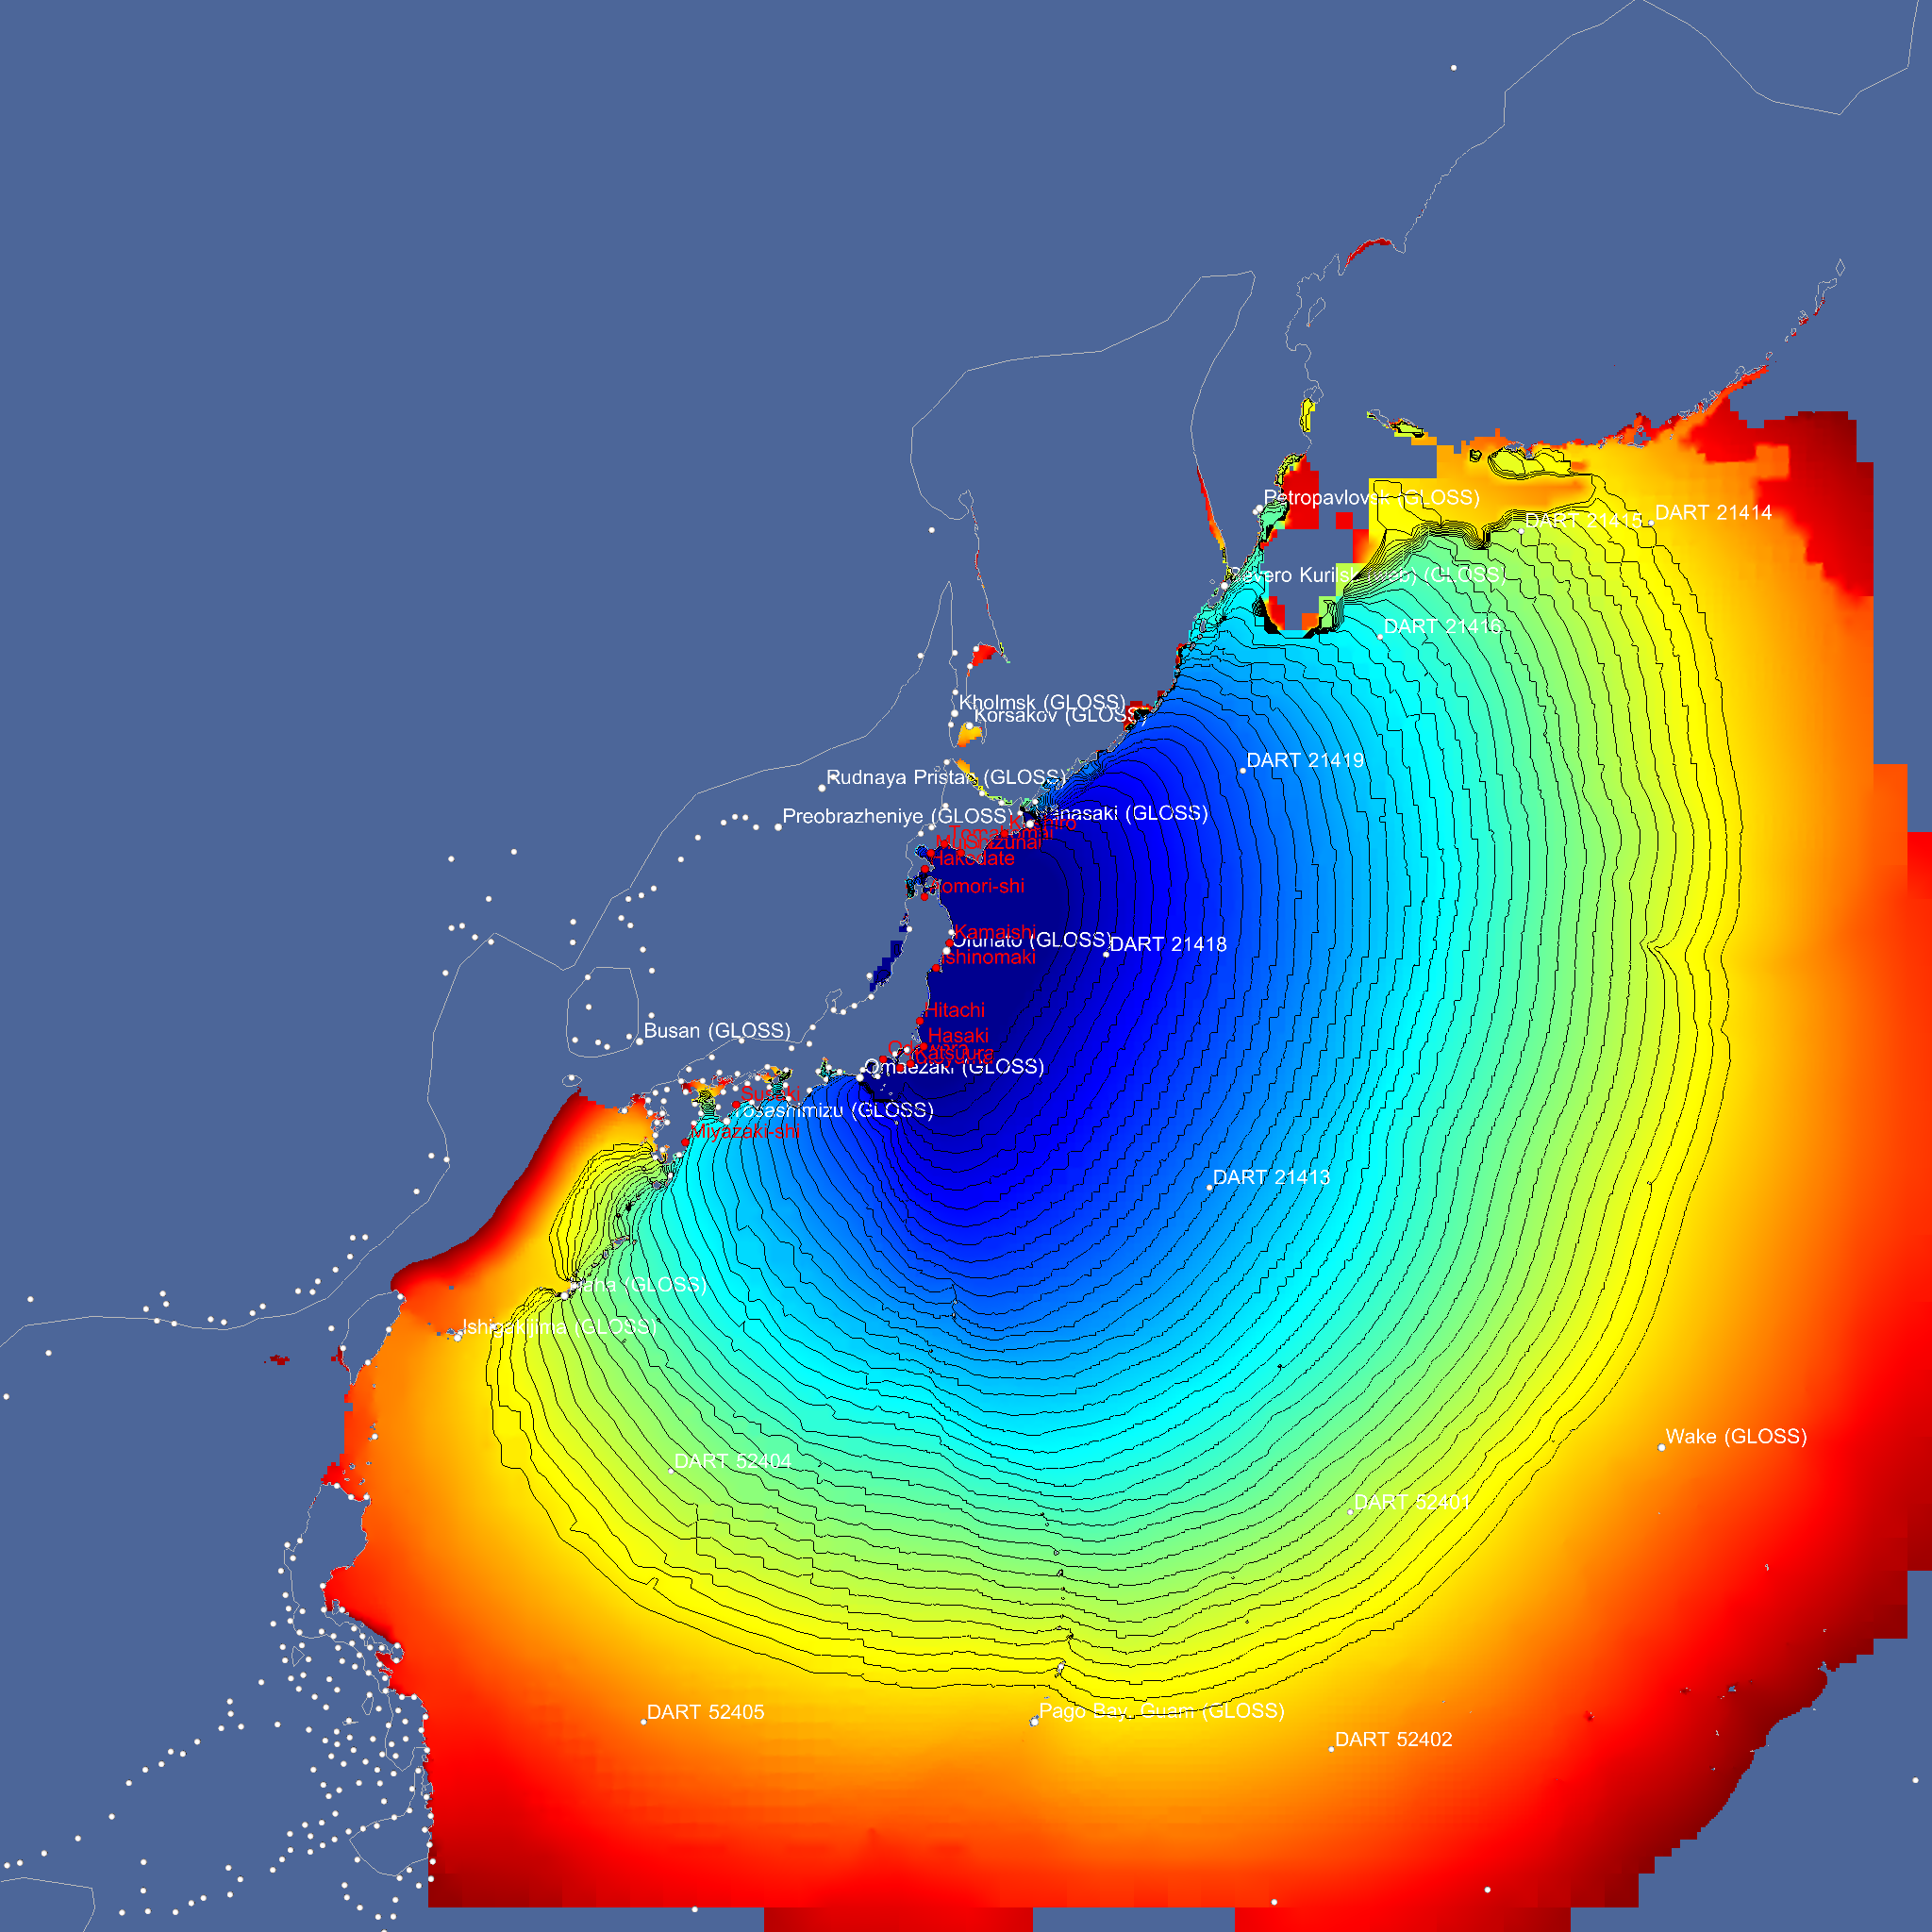
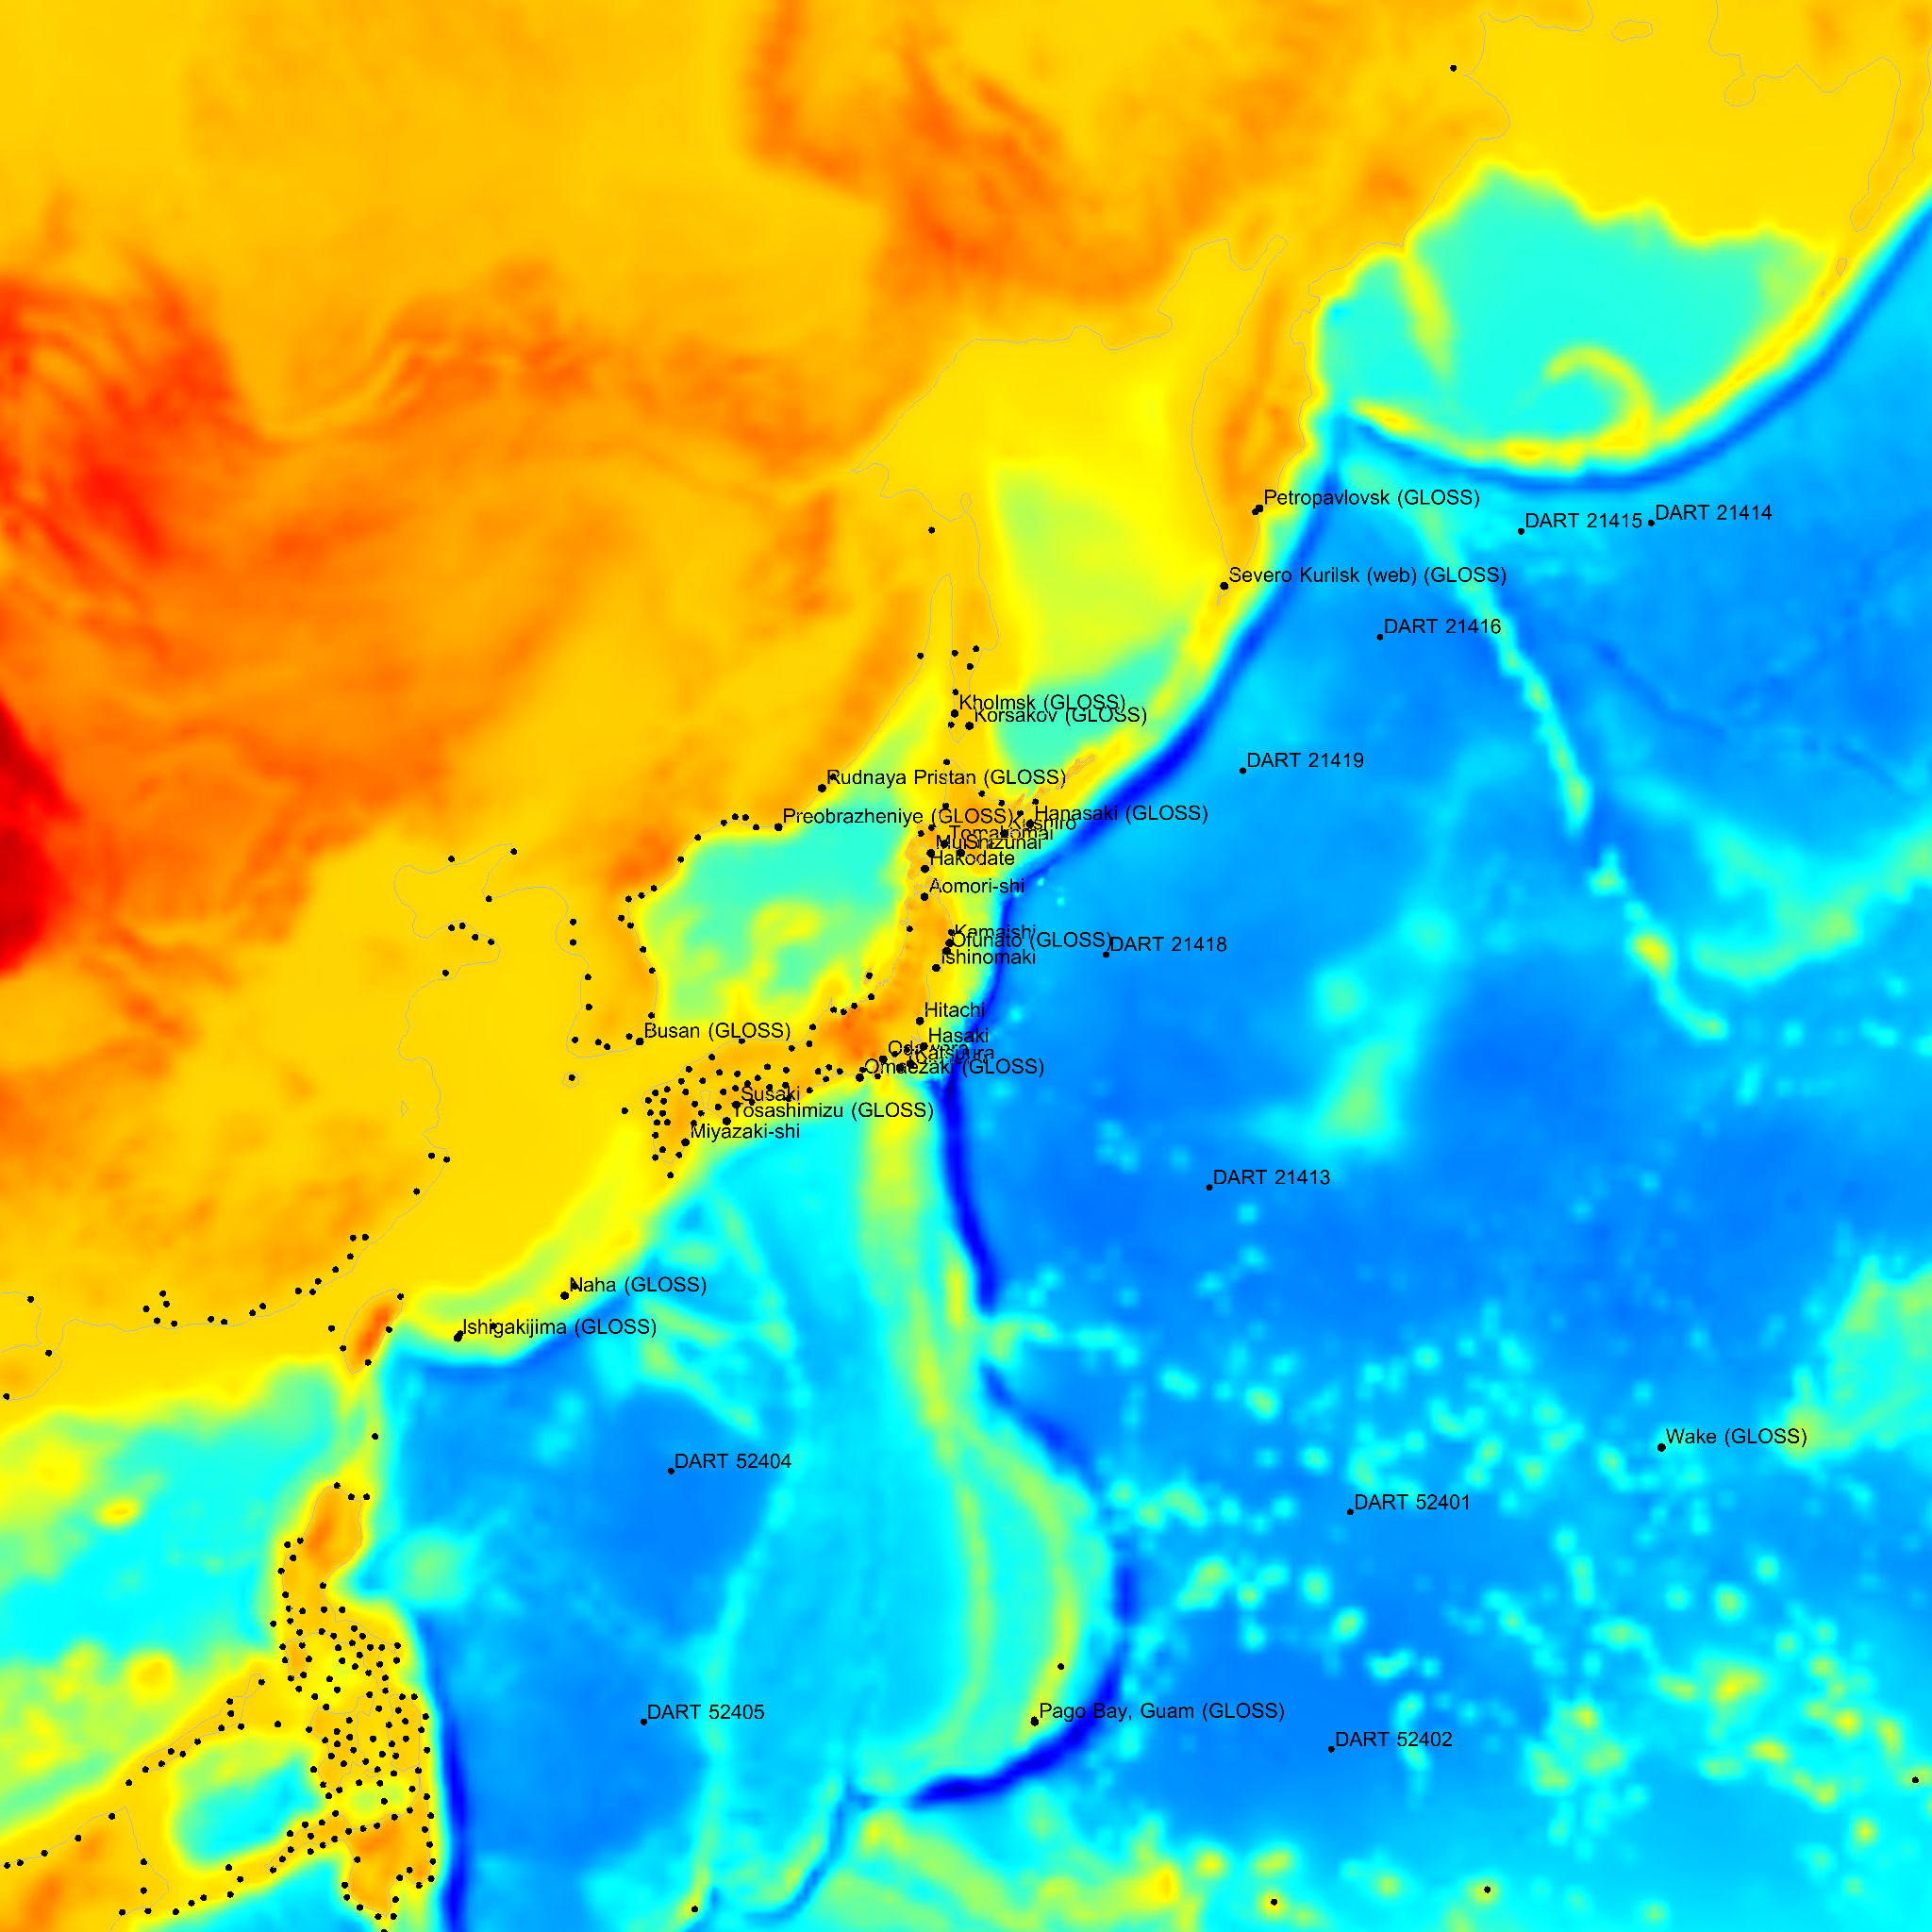
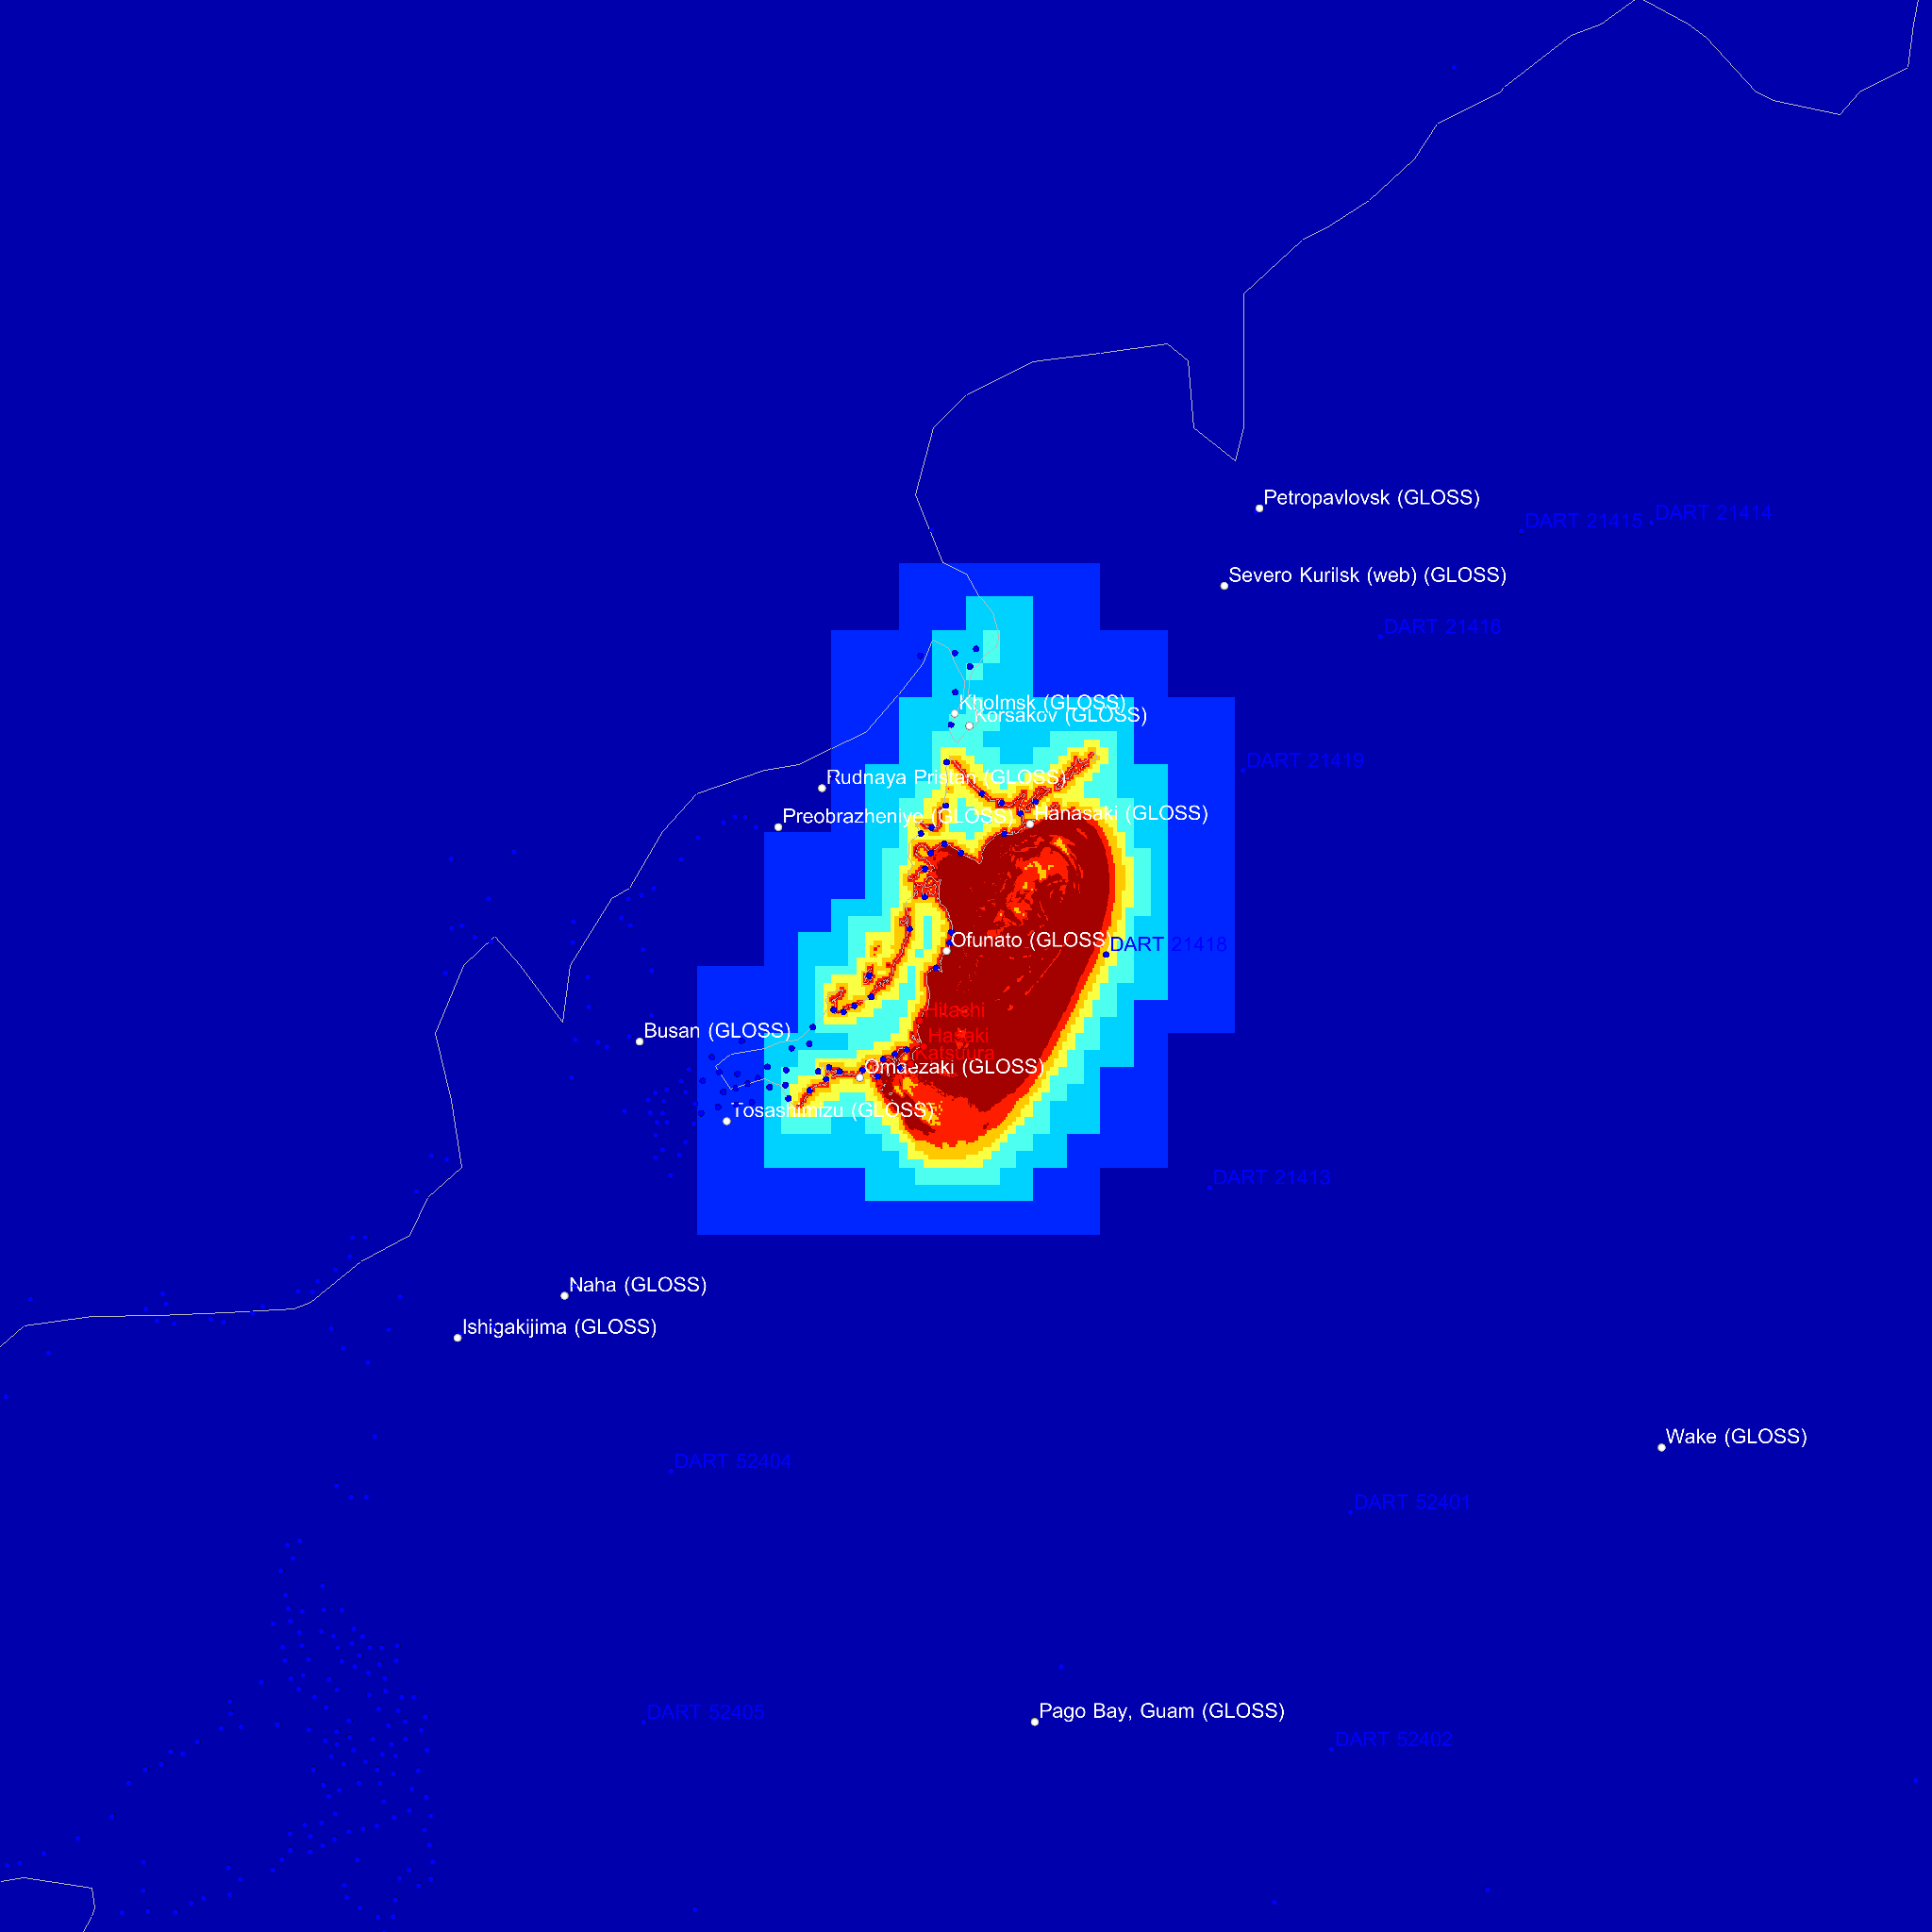
The domain extent is ~8139 km squared.
The maximum spatial resolution is 2.0 km and the minimum resolution 254.4 km.
Initial surface displacement.
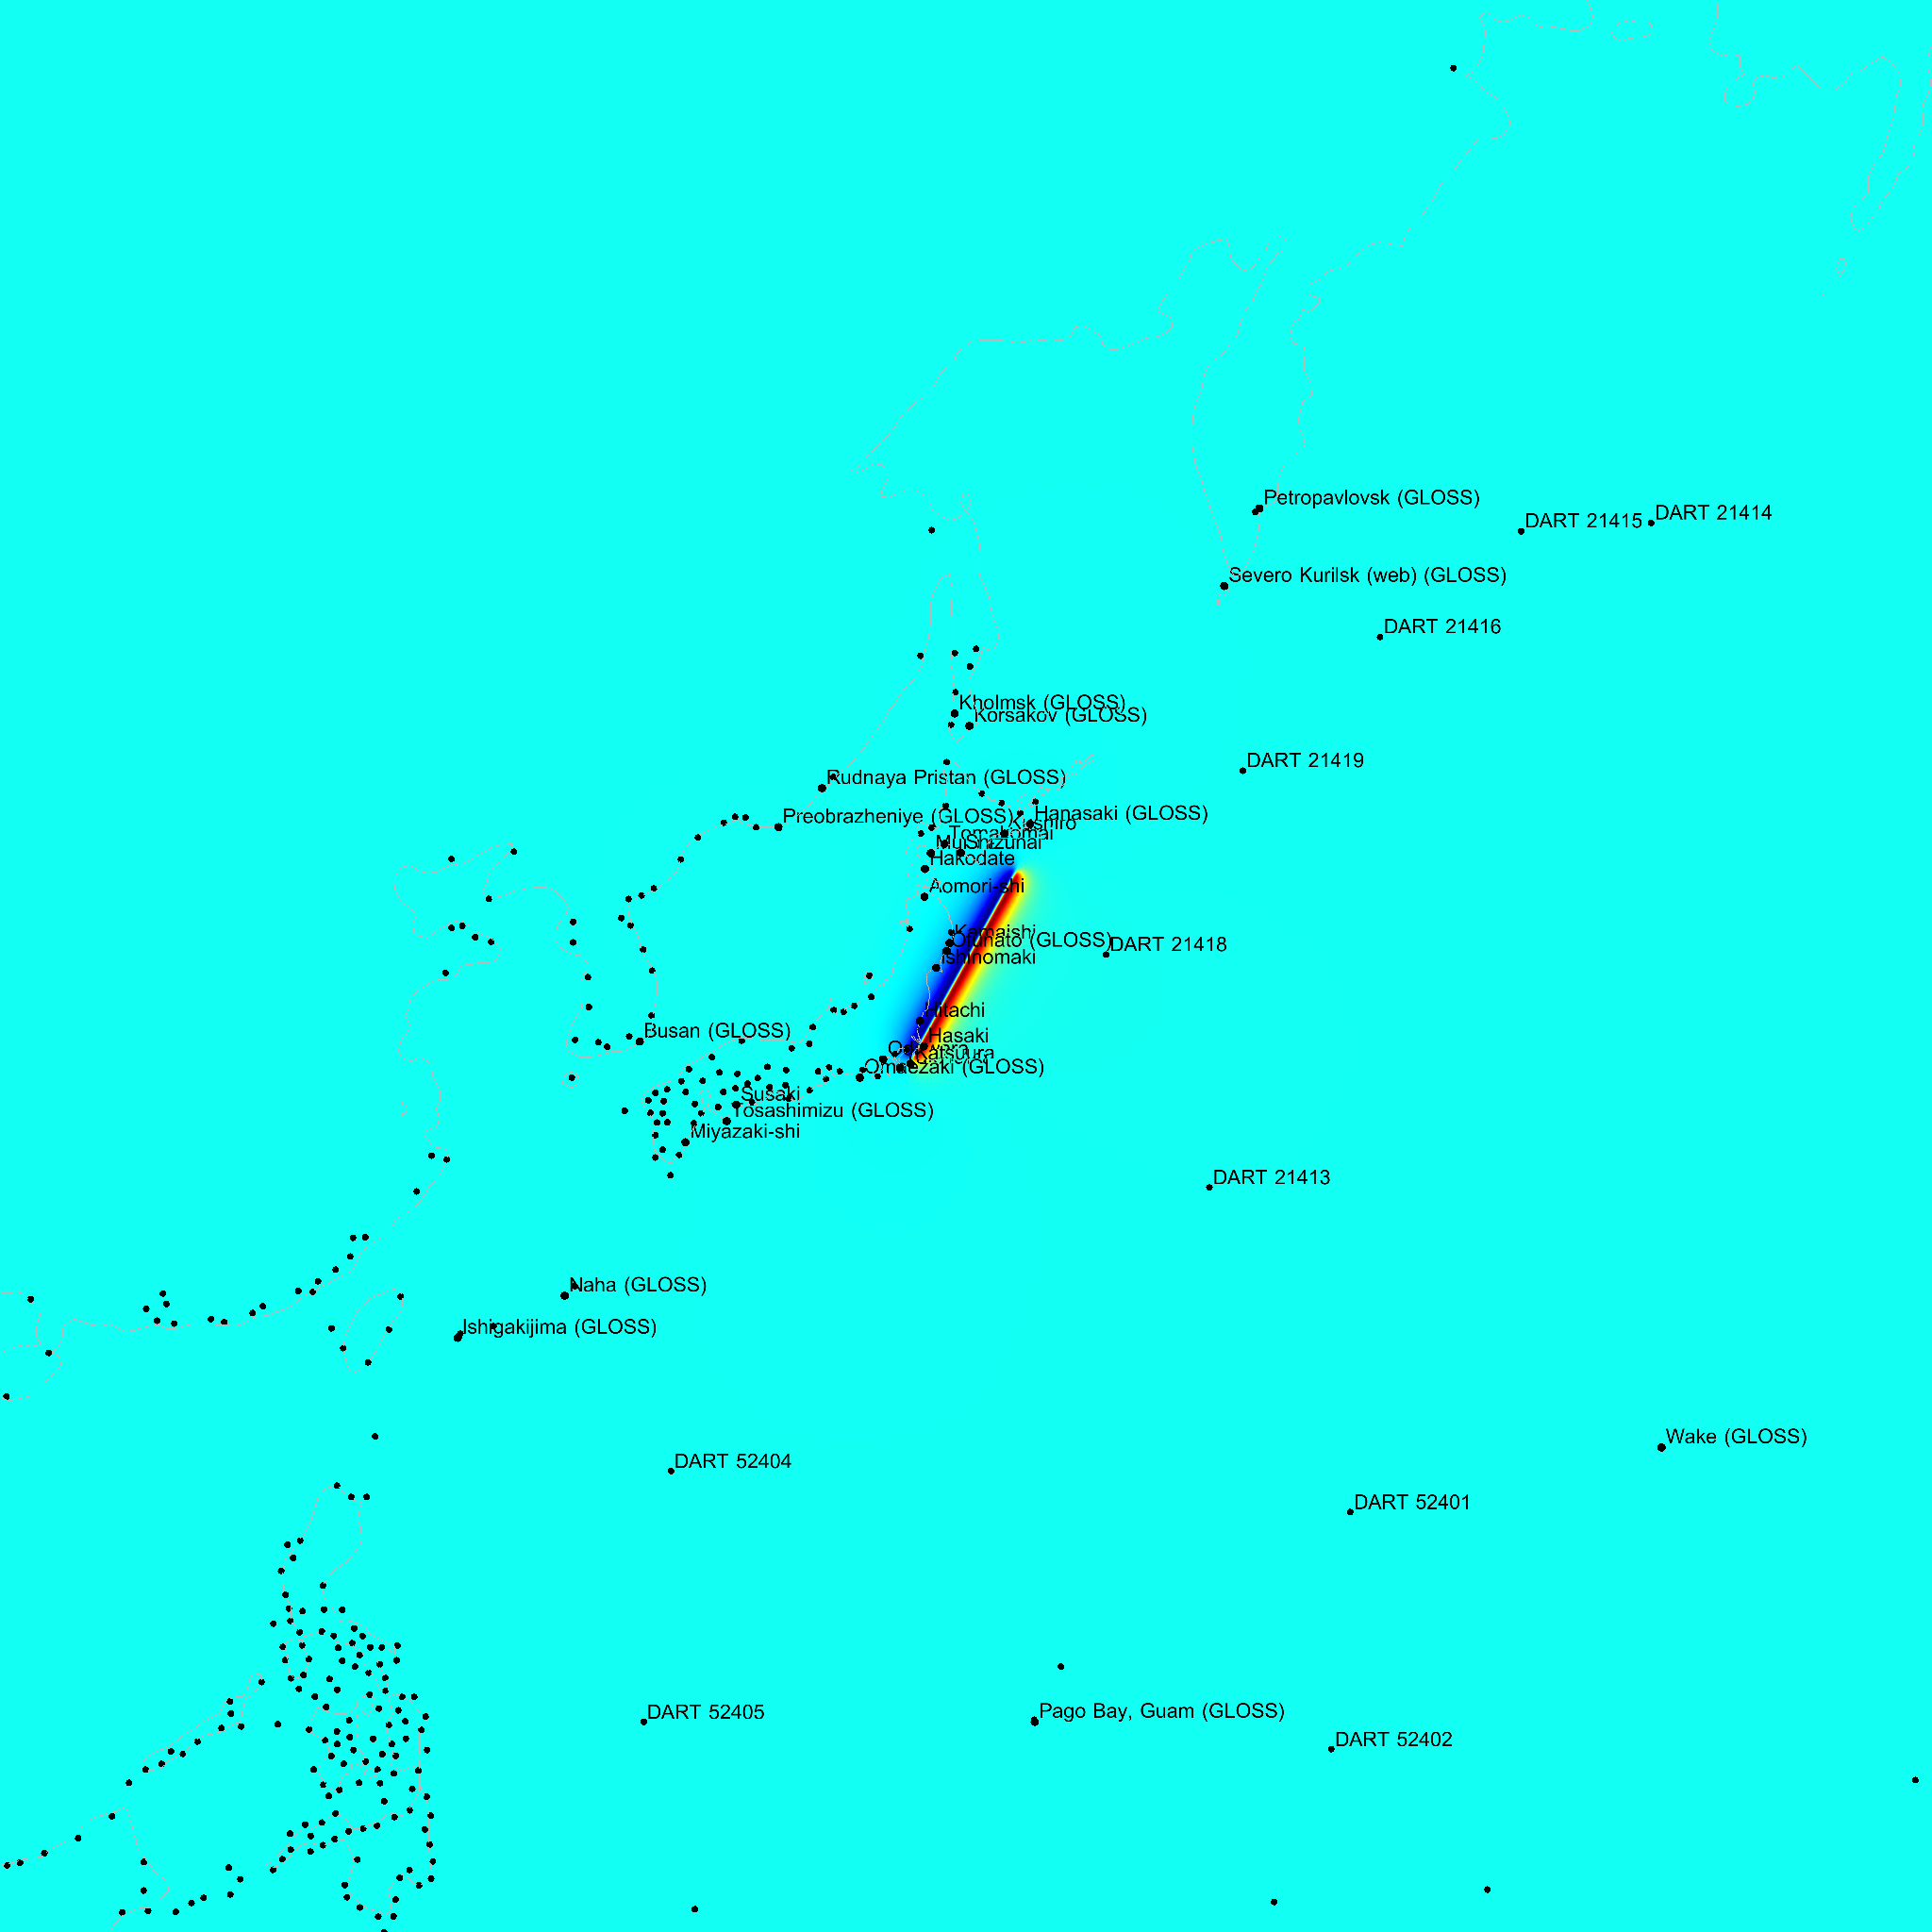
Okada rectangular fault parameters from USGS CMT solution:
lon = 142.597 , lat = 38.486 , strike = 29 , dip = 77 , slip = 95 , depth = 10 km
Geometrical fault parameters from Wells and Coppersmith, 1994:
length = 813.948 km, width = 71.1244 km, displacement = 25.9105 m
Adaptive mesh at early times. The maximum spatial resolution (dark red) is 2.0 km and the minimum resolution (dark blue) is 254.4 km.

Model results

Started:2011/03/15 10:20:38 UTC
Updated:2011/03/16 14:12:12 UTC
Status:Completed

Results for 2011/03/11 10:46:23 UTC (E + 5 h 0 min)

Maximum wave elevation. Arrival time of a wave of elevation larger than 10 cm. The isocontours are at intervals of 5 minutes.

Maximum wave elevation and corresponding arrival time at selected locations

Name Country Population Maximum elevation (m ASL) Arrival time (relative) Arrival time (UTC)
HasakiJP3920910.45 0 sec2011/03/11 05:46:23
HitachiJP18630726.05 25 min2011/03/11 06:11:53
KamaishiJP4310728.12 27 min2011/03/11 06:13:33
KatsuuraJP223071.80 39 min2011/03/11 06:25:23
ShizunaiJP224365.27 46 min2011/03/11 06:32:43
OdawaraJP2030351.54 50 min2011/03/11 06:36:23
HakodateJP2757304.09 1 h 12 min2011/03/11 06:59:03
MuroranJP961973.04 1 h 22 min2011/03/11 07:09:13
TomakomaiJP1748063.81 1 h 24 min2011/03/11 07:10:33
IshinomakiJP11723311.68 1 h 53 min2011/03/11 07:39:53
TateyamaJP500643.06 1 h 59 min2011/03/11 07:46:13
OwaseJP220381.62 2 h 20 min2011/03/11 08:06:43
SusakiJP261951.68 3 h 25 min2011/03/11 09:11:33
Miyazaki-shiJP3112031.87 3 h 41 min2011/03/11 09:27:43
KushiroJP1836122.34 4 h 53 min2011/03/11 10:39:43

Timeseries of wave elevation (metres) at selected locations (time in hours)

Timeseries of wave elevation (metres) at DART buoys locations (time in hours)

DART 21418
DART 21419
DART 21413
DART 21416
DART 52404
DART 52401
DART 21415
DART 52402
DART 52405
DART 21414

Timeseries of wave elevation (metres) at GLOSS stations locations (time in hours)

Ofunato, Japan
Hanasaki, Japan
Omaezaki, Japan
Naha, Japan
Ishigakijima, Japan
Wake, USA
Korsakov, Russia
Pago Bay, Guam, USA
Severo Kurilsk (web), Russia

Animation of wave elevation (dark blue: -50 cm, dark red: +50 cm)

(right click on image for playback options)

Links

Raw model data