13.7 PASS:
Rossby–Haurwitz wave
-
Author
- Stéphane Popinet
- Command
- sh rossby.sh rossby.gfs
- Version
- 120530
- Required files
- rossby.gfs (view) (download)
rossby.sh ehp.gfv ehm.gfv h.gfv href.gfv ec-6 eh-4.ref eh-5.ref eh-6.ref
- Running time
- 15 minutes 54 seconds
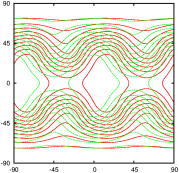
Rossby–Haurwitz waves are analytic solutions of the non-linear
barotropic vorticity equation on the sphere. The parameters for this
test case are those proposed by Williamson et al
[47].
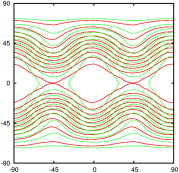
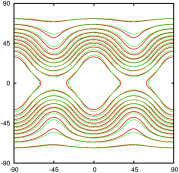
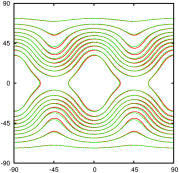
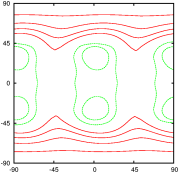
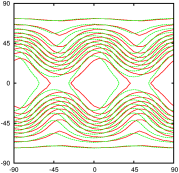
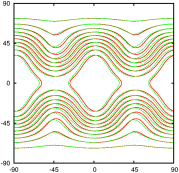
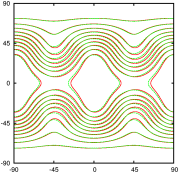
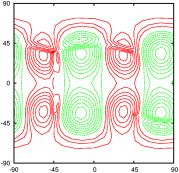
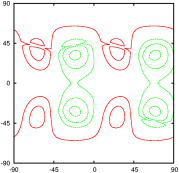
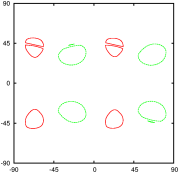
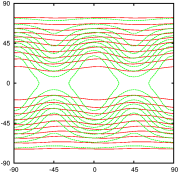
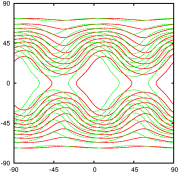
| Figure 184: Detail of height field after one complete revolution
(24 days). Numerical solution in red and reference solution in
green. (a) C16, (b) C32, (c) C64. |
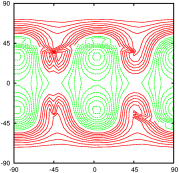
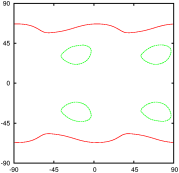
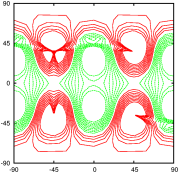
| Figure 185: Detail of relative error field after one
complete revolution (24 days). Red is positive and green
negative. 10 metres contour interval. (a) C16, (b) C32, (c) C64. |
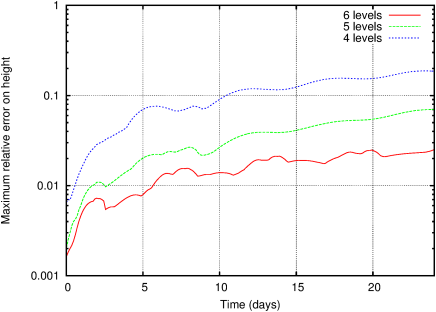
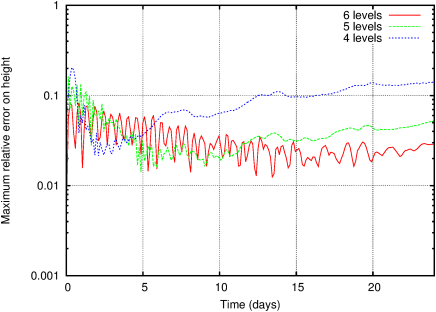
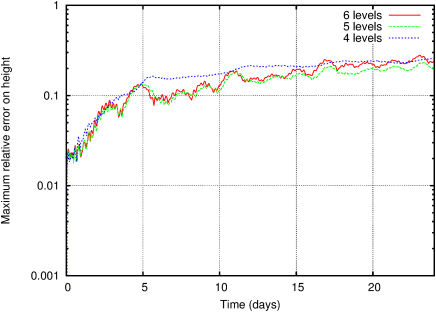
| Figure 186: Evolution of maximum relative error on height with time. |
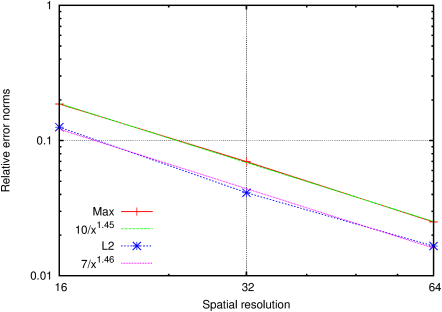
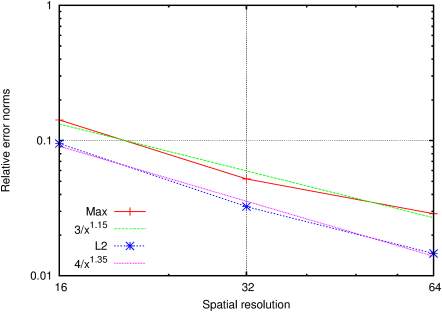
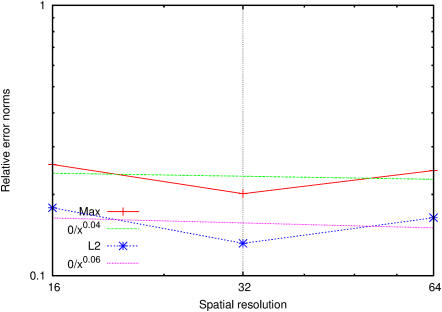
| Figure 187: Convergence of final errors with spatial resolution. |
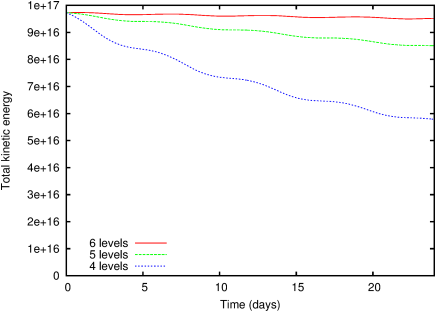
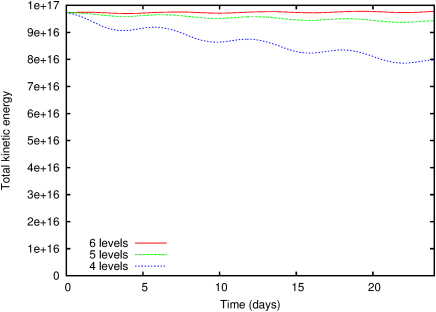
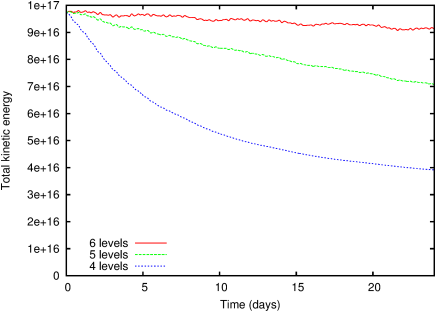
| Figure 188: Evolution of kinetic energy with time. |
13.7.1 PASS:
Rossby–Haurwitz wave with a free surface
-
Author
- Stéphane Popinet
- Command
- sh ../rossby.sh ocean.gfs
- Version
- 120614
- Required files
- ocean.gfs (view) (download)
ehp.gfv ehm.gfv h.gfv href.gfv ec-6 eh-4.ref eh-5.ref eh-6.ref
- Running time
- 9 minutes 13 seconds
Same test case but using the GfsOcean solver implementing an
implicit solution to the linearised shallow-water equations.
The initial transient (geostrophic adjustement) seems to be too
strong.
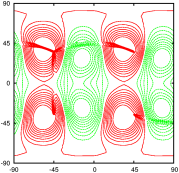
| Figure 189: Detail of height field after one complete revolution
(24 days). Numerical solution in red and reference solution in
green. (a) C16, (b) C32, (c) C64. |
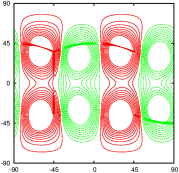
| Figure 190: Detail of relative error field after one
complete revolution (24 days). Red is positive and green
negative. 10 metres contour interval. (a) C16, (b) C32, (c) C64. |
| Figure 191: Evolution of maximum relative error on height with time. |
| Figure 192: Convergence of final errors with spatial resolution. |
| Figure 193: Evolution of kinetic energy with time. |
13.7.2 PASS:
Rossby–Haurwitz wave with Saint-Venant
-
Author
- Stéphane Popinet
- Command
- sh ../rossby.sh river.gfs
- Version
- 120812
- Required files
- river.gfs (view) (download)
ehp.gfv ehm.gfv h.gfv href.gfv ec-6 eh-4.ref eh-5.ref eh-6.ref
- Running time
- 18 minutes 15 seconds
Same test case but using the Saint-Venant solver.
| Figure 194: Detail of height field after one complete revolution
(24 days). Numerical solution in red and reference solution in
green. (a) C16, (b) C32, (c) C64. |
| Figure 195: Detail of relative error field after one
complete revolution (24 days). Red is positive and green
negative. 10 metres contour interval. (a) C16, (b) C32, (c) C64. |
| Figure 196: Evolution of maximum relative error on height with time. |
| Figure 197: Convergence of final errors with spatial resolution. |
| Figure 198: Evolution of kinetic energy with time. |