

9.2 PASS:
Planar capillary waves
-
Author
- Stéphane Popinet
- Command
- sh capwave.sh capwave.gfs
- Version
- 1.1.0
- Required files
- capwave.gfs (view) (download)
capwave.sh convergence.ref prosperetti markers.tex surfer.tex prost.tex clsvof.tex
- Running time
- 5 minutes 42 seconds
A small amplitude sinusoidal wave oscillates under surface
tension. Prosperetti [36] found a solution to this
initial value problem in the limit of a vanishingly small initial
amplitude.
The domain size is 1x3 units, large enough to minimise the effect of
boundaries (Prosperetti’s theory is valid for infinite domains).
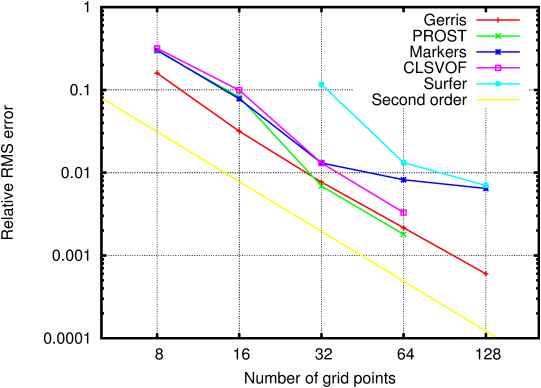
Table 9 shows the convergence of various solvers as
a function of resolution: Gerris, the marker technique of
[35], Surfer [18], PROST and CLSVOF
[17]. The same data is represented on Figure 114.
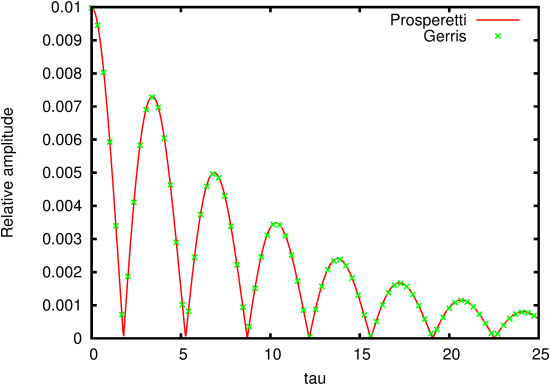
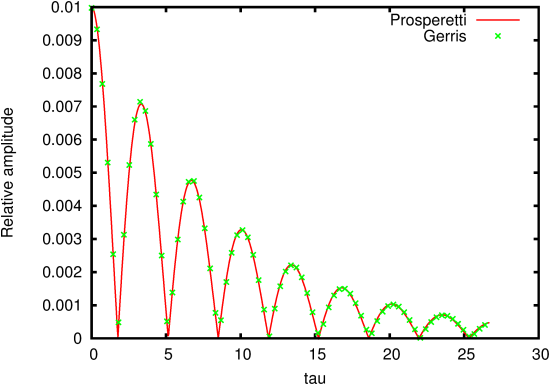
The time-evolution of the amplitude given by Prosperetti’s theory
and Gerris (642) is given on Figure 115.
| Table 9: Convergence of the relative error between the analytical
solution and simulation results from various solvers. |
| Method | 82 | 162 | 322 | 642 | 1282 |
| Gerris | 0.15914 | 0.03162 | 0.00770 | 0.00216 | 0.000545 |
| Markers | 0.3018 | 0.0778 | 0.0131 | 0.0082 | 0.00645 |
| Surfer | - | - | 0.1168 | 0.0132 | 0.007 |
| PROST | 0.2960 | 0.0818 | 0.0069 | 0.0018 |
| CLSVOF | 0.3169 | 0.0991 | 0.0131 | 0.0033 |
| Figure 114: Convergence of the RMS error as a
function of resolution (number of grid points per wavelength) for
the methods indicated in the legend. |
| Figure 115: Evolution of the amplitude of the capillary wave as a
function of non-dimensional time τ=ω0 t. |
9.2.1 PASS:
Fluids of different densities
-
Author
- Stéphane Popinet
- Command
- sh ../capwave.sh density.gfs
- Version
- 1.1.0
- Required files
- density.gfs (view) (download)
convergence.ref prosperetti
- Running time
- 5 minutes 31 seconds
Same test as before but with a density ratio of 10. The dynamic
viscosities are identical.
Table 10 shows the convergence of various
solvers as a function of resolution: Gerris, the marker technique of
[35] and Surfer [18].
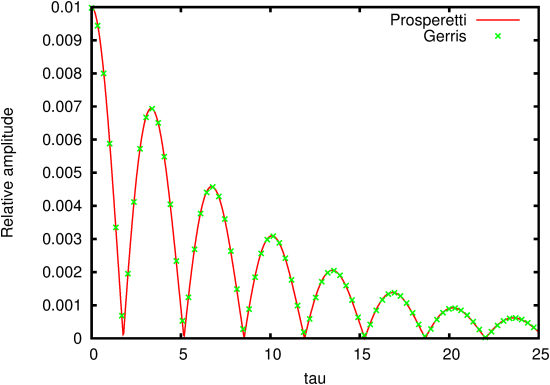
The time-evolution of the amplitude given by Prosperetti’s theory
and Gerris (642) is given on Figure 116.
| Table 10: Convergence of the relative error between the analytical
solution and simulation results from various solvers. |
| Method | 82 | 162 | 322 | 642 | 1282 |
| Gerris | 0.14971 | 0.04804 | 0.01001 | 0.00281 | 0.001155 |
| Markers | 0.3593 | 0.1397 | 0.0566 | 0.0264 | 0.0148 |
| Surfer | - | - | 0.1233 | 0.0300 | 0.0254 |
| Figure 116: Evolution of the amplitude of the capillary wave as a
function of non-dimensional time τ=ω0 t. |
9.2.2 PASS:
Air-Water capillary wave
-
Author
- Stéphane Popinet
- Command
- sh ../capwave.sh air-water.gfs
- Version
- 1.2.0
- Required files
- air-water.gfs (view) (download)
convergence.ref prosperetti
- Running time
- 12 minutes 39 seconds
Same test as before but with density and viscosity ratio
corresponding to an air/water interface.
| Table 11: Convergence of the relative error between the analytical
solution and simulation results. |
| Method | 82 | 162 | 322 | 642 | 1282 |
| Gerris | 0.20409 | 0.07954 | 0.01908 | 0.00691 | 0.00313 |
| Figure 117: Evolution of the amplitude of the capillary wave as a
function of non-dimensional time τ=ω0 t. |
9.2.3 PASS:
Pure gravity wave
-
Author
- Stéphane Popinet
- Command
- sh ../capwave.sh gravity.gfs
- Version
- 1.0.0
- Required files
- gravity.gfs (view) (download)
convergence.ref prosperetti
- Running time
- 2 minutes 16 seconds
Similar to the capillary wave test case but for a pure gravity
wave. The density ratio is 10. The dynamic viscosities are
identical.
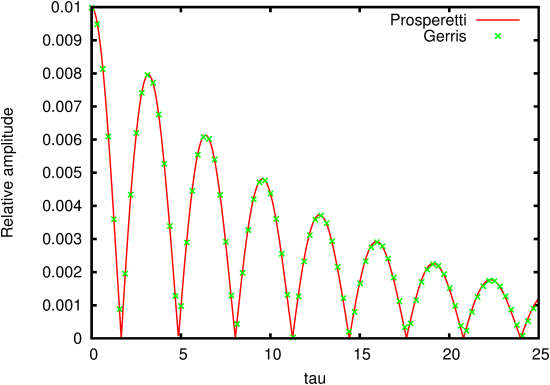
The time-evolution of the amplitude given by Prosperetti’s theory
and Gerris (642) is given on Figure 118.
| Table 12: Convergence of the relative error between the analytical
solution and simulation results. |
| Method | 82 | 162 | 322 | 642 | 1282 |
| Gerris | 0.17816 | 0.04315 | 0.01107 | 0.00630 | 0.00417707 |
| Figure 118: Evolution of the amplitude of the gravity wave as a
function of non-dimensional time τ=ω0 t. |


