The geometrical Volume-Of-Fluid (VOF) advection scheme of Gerris is used to simulate the air-water interface around a “Series 60 CB=0.6” ship hull. This hull shape is a classical towing tank test case and several experimental dataset are available (see for example the University of Iowa web site).
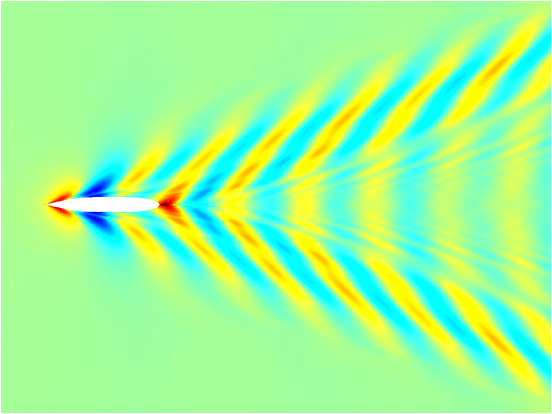
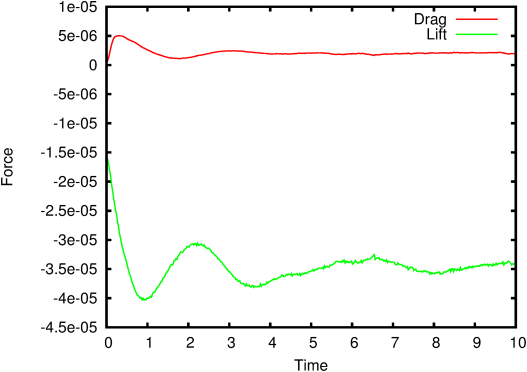
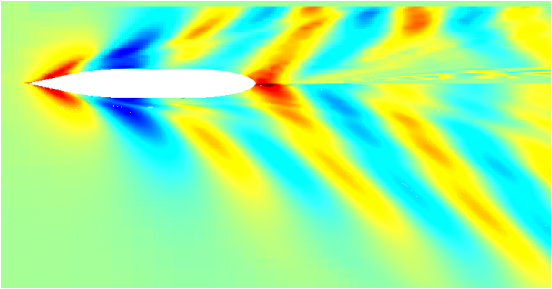
The liquid is started impulsively from rest to a Froude number of 0.316 corresponding to one of the towing tank cases. The evolution of the interface is illustrated in Figures 22 and 23. After the initial transients have dissipated (Figure 24), the stationary wave pattern can be compared with the experimental measurements (Figure 25). Adaptivity is used based on the value of vorticity in the liquid only. With the relatively high-resolution used here, damping of the final wave pattern is minimal which illustrates the good energy conservation properties of the overall scheme (but requires a significant amount of CPU time).
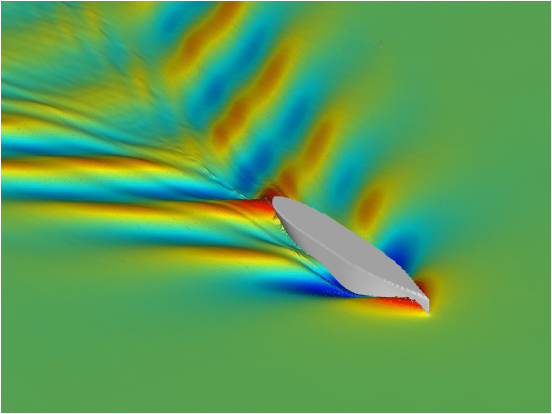
Only one half of the flow is simulated. The GfsView parameter file closeup.gfv shows how to setup the “Symmetry” objects to display the full symmetrical flow.
Figure 22: MPEG movie of the interface evolution. The interface is coloured according to elevation. The vertical scale is exagerated by a factor of three.