


As observed by Félix Savart and Joseph Plateau, and confirmed theoretically by Lord Rayleigh, a column of liquid spontaneously breaks up into droplets under the influence of surface tension. An example of this process is given in the animation of Figure 15 for a column of water in air. The solution is computed using a 3D Volume-Of-Fluid (VOF) representation of the interface. The interface in Figure 15 is represented using the VOF-reconstructed fragments. This explains the narrow gaps which can sometimes be seen between fragments in the animation.
Adaptivity is used to track the regions with high curvature which are created during breakup. The evolution of spatial resolution along the interface is illustrated in Figure 16 where the resolution doubles for each change in colour. A detail of the adaptive mesh close to the point of breakup is shown in Figure 17.
For this particular example, using adaptivity leads to orders-of-magnitude gains compared to an equivalent simulation on a regular Cartesian mesh (Figure 18).
Figure 18: Total number of grid points as a function of time. A regular Cartesian grid with an equivalent maximum spatial resolution would require 230≈ one billion grid points. 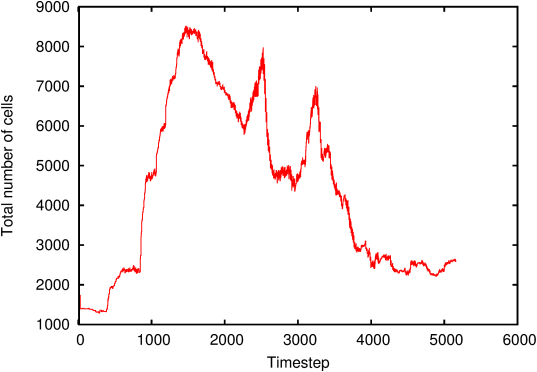
A more detailed study of these simulations is given in Popinet (2009), Journal of Computational Physics, 228.