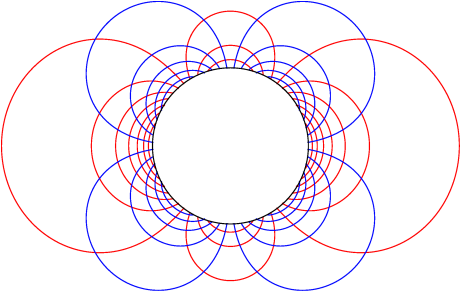
The axisymmetric potential flow around a sphere is computed (Figure 70) and compared to the theoretical solution [23]. A large domain is used together with variable spatial resolution to minimise the influence of the finite domain size.
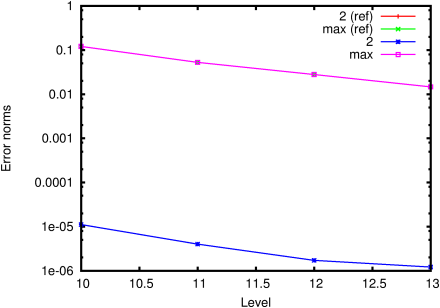
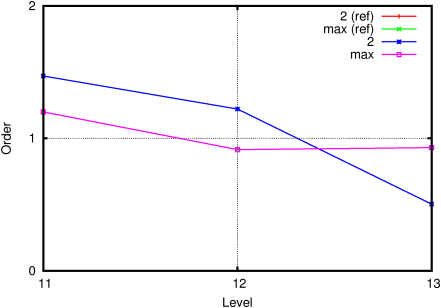
Figure 71 and 72 illustrate the convergence of the solution for the horizontal component of velocity with increased resolution.
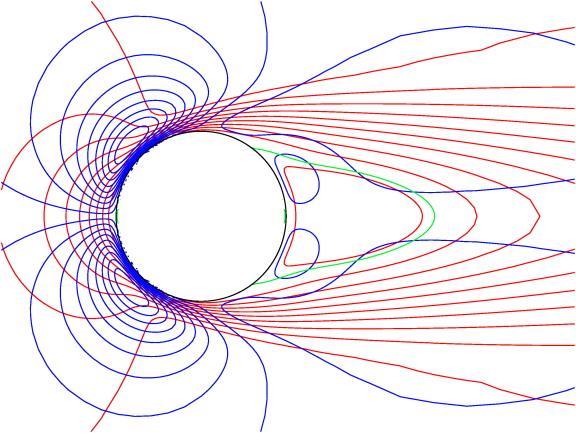
When viscosity is added, a recirculation region develops behind the sphere (Figure 73).
The length of the recirculation depends on the Reynolds number. Figure 74 plots the results obtained with Gerris as well as previously published results. Published results agree with Gerris for Reynolds numbers smaller than 100. The mismatch for results at Reynolds 200 can be attributed to the coarse mesh used to resolve the wake in the studies of Fornberg [16] and Fadlun et al [15].
Figure 74: Relative length of the recirculation region as a function of the Reynolds number. The results of Gerris are compared with the results of Masliyah & Epstein [28], Fornberg [16], Blanco & Magnaudet [8], Fadlun et al [15] and Zhang & Zheng [48]. 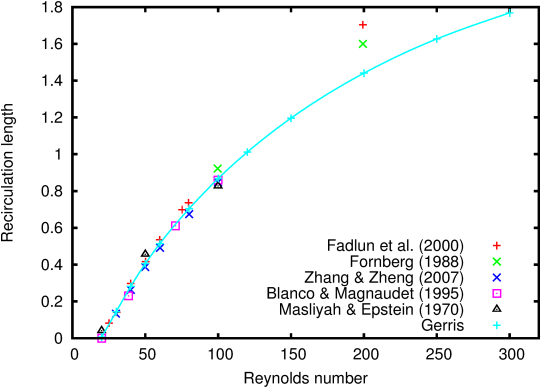
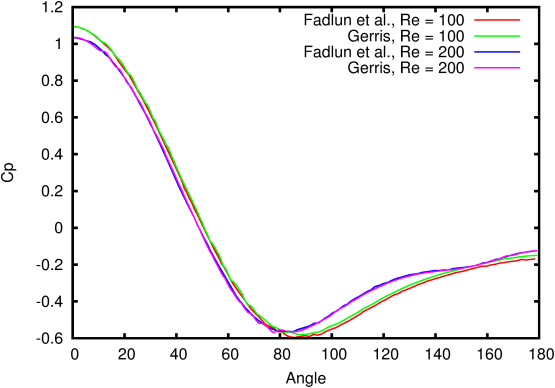
The pressure profiles are also in good agreement with those reported by Fadlun et al (which also agree with those of Fornberg) (Figure 75).